Conceptual Modeling Using Star Schemas
Verified Concept Article • Factual Traceability Enabled
Summary OverviewStar schemas provide a simple, intuitive conceptual model that centers a fact table surrounded by dimension tables, enabling efficient multidimensional analysis in data warehouses.
Overview
Conceptual modeling is the first step in designing a data warehouse, where the logical view of business processes is captured before physical implementation. Among the principal conceptual models, the star schema stands out for its clarity and ease of use. It represents a fact table at the core, linked directly to a set of denormalized dimension tables, forming a star‑shaped diagram. This arrangement aligns with the multidimensional data model that views data as a data cube, allowing analysts to slice, dice, and aggregate measures across multiple dimensions such as time, product, and geography.
Star Schema Structure
In a star schema, the fact table stores quantitative measures (e.g., dollarssold, unitssold, avg_sales) and foreign keys that reference each dimension. Each dimension table contains descriptive attributes that provide context for analysis. For example, a typical sales star schema includes dimensions like time (day, month, quarter, year), item (itemname, brand, type, suppliertype), and branch (branchname, street, city, country). The fact table connects to these dimensions through surrogate keys such as timekey, itemkey, and branchkey, ensuring fast joins during query execution.
Role of Dimensions and Facts
Dimensions capture the who, what, where, and when of business events. They are often hierarchical; the time dimension can roll up from day to month to quarter, while the item dimension may group products by brand or type. The fact table records events or processes that evolve over time, embodying the principle that "time is always associated to a fact" as highlighted in conceptual modeling guidelines. By storing measures alongside foreign keys, the star schema enables straightforward aggregation across any combination of dimensions, supporting the construction of base cuboids and the apex cuboid at the top of the cube lattice.
Comparison with Snowflake and Fact Constellations
While the star schema keeps dimensions denormalized for query performance, the snowflake schema normalizes hierarchical attributes into separate tables, producing a more intricate, snowflake‑shaped graph. Both share the same central fact, but the snowflake trades simplicity for reduced redundancy. A fact constellation (or galaxy schema) extends the concept by allowing multiple fact tables to share common dimensions, supporting complex analytical scenarios such as simultaneous sales and shipping analysis. Nonetheless, the star schema remains the foundational pattern from which these variations evolve.
Design Considerations
Creating an effective star schema begins with identifying the business process to be measured and the key performance indicators (KPIs) that become measures. Designers must then select appropriate dimensions and decide on their granularity. Hierarchies should be explicitly modeled to support roll‑up and drill‑down operations. Although the conceptual stage is largely manual, automated tools can assist in generating the schema based on source metadata, but human judgment is essential for choosing meaningful facts and dimensions.
Benefits for Decision Support
The star schema’s flat, intuitive layout simplifies SQL query writing and boosts performance through reduced join complexity. Its alignment with the multidimensional cube model makes it ideal for OLAP tools, enabling rapid generation of reports, dashboards, and ad‑hoc analyses. By presenting data around a single subject—such as sales—while excluding extraneous operational details, the star schema fulfills the subject‑oriented nature of data warehouses and equips decision makers with a concise, high‑level view of critical business information.
Visual References from Cited Pages
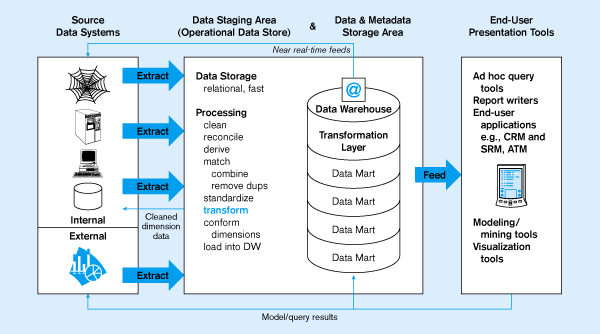
Figure 1: Diagram illustrating the relationship between logical data marts, ODS, and the data warehouseSource: ETLmodelling.pdf (Page 18)

Figure 2: Diagram of data warehouse architecturesSource: ETLmodelling.pdf (Page 14)
Related Topics
Incoming Backlinks
Other pages in this wiki that link back to the current topic.