Abstraction Levels in Interface Design
Verified Concept Article • Factual Traceability Enabled
Summary OverviewAbstraction levels organize interface design into hierarchical strata that progressively hide technical detail, enabling unified interaction with heterogeneous systems.
Conceptual Foundations
Abstraction in interface design refers to the systematic hiding of lower‑level technical details behind higher‑level constructs that are easier for users and developers to reason about. As defined in the broader context of system integration, the goal is to give users the illusion of interacting with a single information system despite underlying heterogeneity (Source 11). This illusion relies on a unified global data model and common semantics that serve as the topmost abstraction layer (Source 3, Source 4).
Hierarchy of Abstraction Levels
The abstraction hierarchy typically comprises several recognizable tiers (illustrated in the images on page 21, Source 1 & 2):
- Physical/Data Source Layer – Raw, distributed databases or services, each with its own schema, query language, and access protocol.
- Integration Middleware Layer – Middleware components that translate, mediate, and orchestrate data flows, providing reusable services such as authentication, transformation, and routing (Source 12).
- Unified Logical Model Layer – A global data model that presents a homogeneous logical view of the disparate sources, enforcing a consistent semantic interpretation (Source 3, Source 4).
- Presentation / User Interface Layer – The concrete UI presented to the user, which may range from bespoke point‑to‑point screens to a common web‑based portal (Source 9, Source 10).
Each higher level abstracts the complexities of the levels below, allowing developers to focus on design concerns appropriate to that stratum.
From Point‑to‑Point to Middleware
Early integration efforts often relied on point‑to‑point interfaces, where every pair of systems required a dedicated connector. This approach leads to combinatorial explosion of interfaces and steep maintenance costs (Source 7, Source 8). By introducing a middleware layer, integration can be centralized: instead of N×N connectors, each system connects once to the middleware, which then handles the necessary translations. However, middleware does not eliminate integration effort entirely; developers still need to compose multiple middleware tools to achieve full system cohesion (Source 12).
Implications for Interface Complexity
At the lowest abstraction level, users must directly interact with each system’s native UI and query language, requiring detailed knowledge of data location, representation, and semantics (Source 5, Source 6). Moving up one level, a common user interface (e.g., a web browser) offers a uniform look and feel but still presents data from each source separately, leaving the burden of homogenization to the user (Source 9, Source 10). Only when the unified logical model is exposed through a well‑designed UI does the user experience true integration, as the system internally resolves heterogeneity.
Practical Strategies
To manage interface complexity, designers should:
- Identify the appropriate abstraction level for each stakeholder, providing low‑level APIs for developers while shielding end‑users with high‑level portals.
- Leverage middleware to encapsulate translation logic, reducing the number of direct connectors.
- Define a global data model early in the project to guide schema mapping and semantic alignment.
- Iteratively refine the UI, ensuring that each new layer adds meaningful simplification without obscuring essential functionality.
By consciously applying these abstraction levels, organizations can transform a tangled web of point‑to‑point interfaces into a coherent, maintainable ecosystem that delivers a seamless user experience.
Visual References from Cited Pages
Figure 1: Image page 2, image 1Source: DataIntegration.pdf (Page 2)
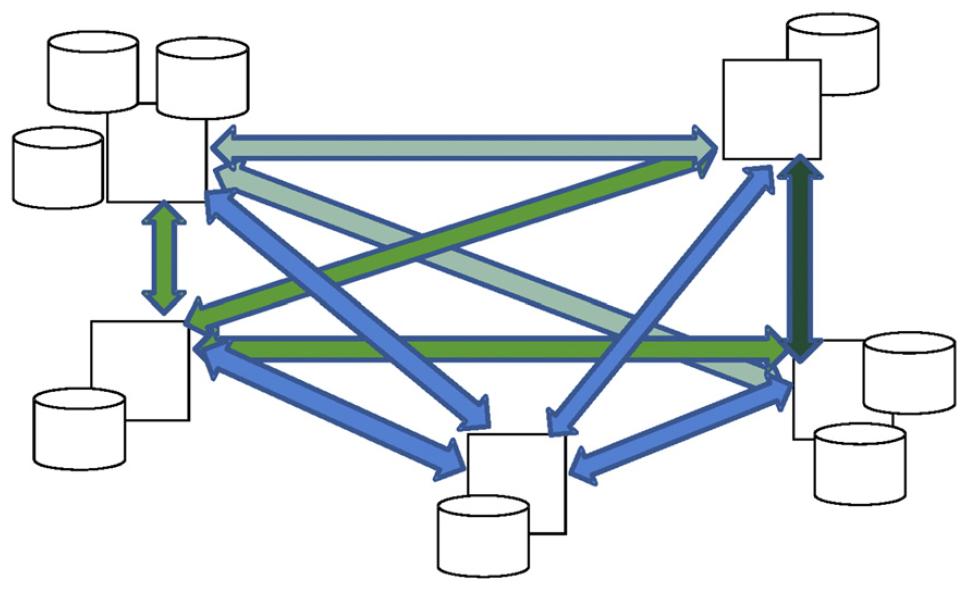
Figure 2: Diagram illustrating point-to-point interface complexitySource: DataIntegration.pdf (Page 8)
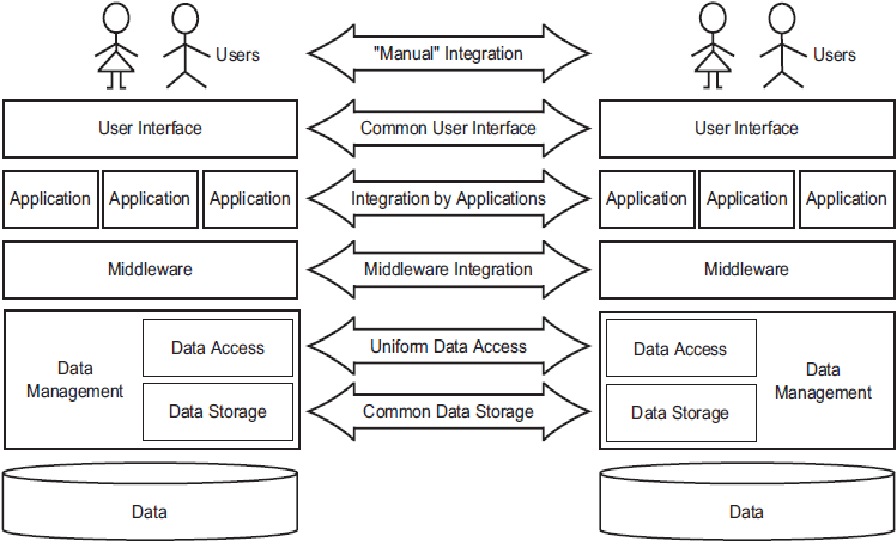
Figure 3: Abstraction Levels diagramSource: DataIntegration.pdf (Page 21)
Related Topics
Incoming Backlinks
Other pages in this wiki that link back to the current topic.